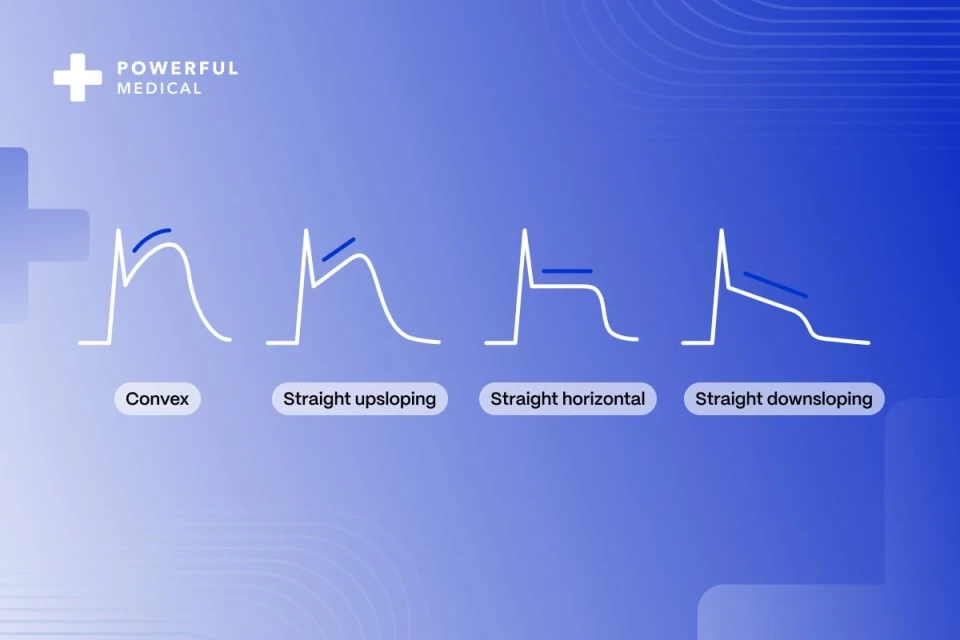

Unmasking Hyperkalemia: Highlighting Critical ECG Changes
Hyperkalemia, defined as serum potassium levels exceeding 5.0 mEq/L, is a silent but deadly threat. Its potential to cause life-threatening arrhythmias1 makes early recognition crucial in emergency medicine. If left undiagnosed, it can rapidly disrupt cardiac electrical activity, progressing to cardiac arrest.
Hyperkalemia, defined as serum potassium levels exceeding 5.0 mEq/L, is a silent but deadly threat. Its potential to cause life-threatening arrhythmias1 makes early recognition crucial in emergency medicine. If left undiagnosed, it can rapidly disrupt cardiac electrical activity, progressing to cardiac arrest. Early detection and prompt management are crucial to prevent adverse outcomes, especially as hyperkalemia is one of the most common reversible causes of cardiac arrest.2
ECG is a widely accessible and non-invasive diagnostic tool, invaluable in detecting hyperkalemia by revealing characteristic ECG changes.3,4 This article explores the key ECG characteristics of hyperkalemia, highlighting how it can mimic hyperacute T waves, a commonSTEMI equivalent pattern, and its clinical significance. Furthermore, it examines the capability of advanced AI-based platforms like PMcardio to enhance diagnostic precision by differentiating between hyperkalemia-induced ECG abnormalities and true myocardial infarction (MI) patterns.
First Signs of Hyperkalemia on the ECG
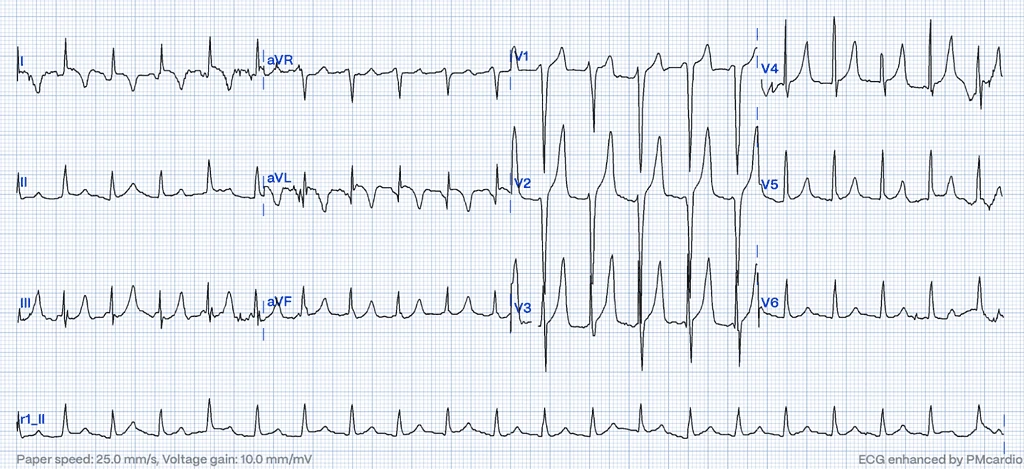
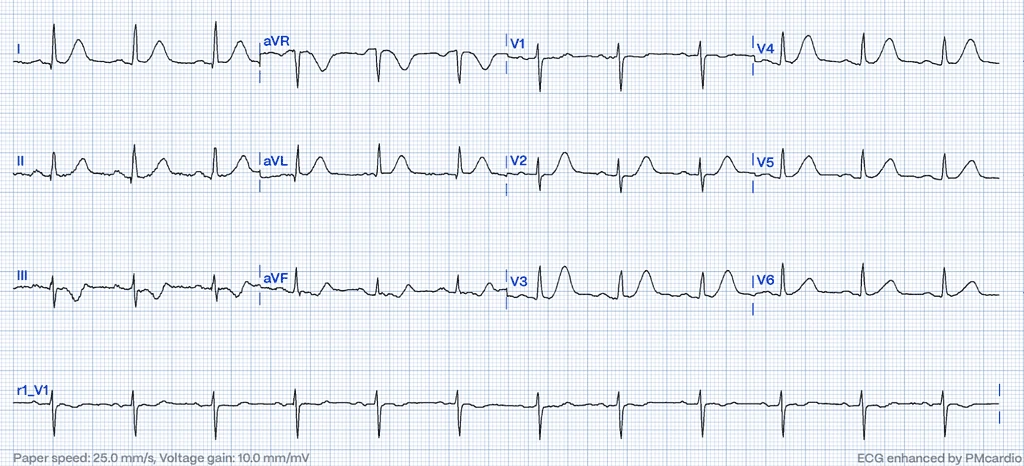
Elevated extracellular potassium disrupts sodium influx into cardiac cells, decreases myocardial conduction velocity while accelerating the heart’s repolarization phase, resulting in a distinct sequence of changes on the surface ECG.5 One of the earliest and most characteristic ECG patterns is the appearance of peaked T waves. However, it is not simply the height of these T waves that is crucial, but rather the narrowing of their base6,7. As potassium levels increase, conduction through the atrioventricular (AV) node slows down, causing the PR interval to extend beyond the normal range of greater than 200 milliseconds.
The Severe Manifestation: Sine-Wave Patterns
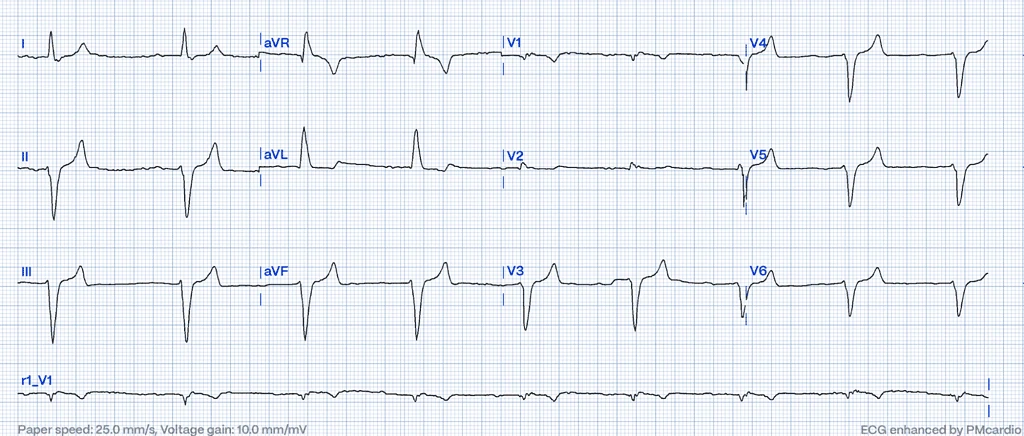
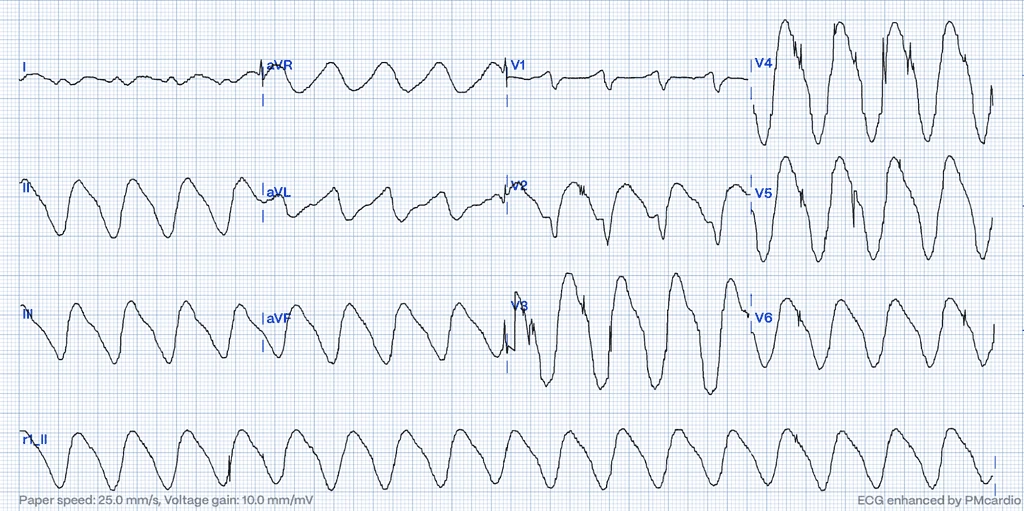
In the most severe stages of hyperkalemia, the QRS complex progressively widens, the T waves broaden and may eventually merge with the widened QRS complexes with the equally wide and broad-based ST-T segments, producing the classic “sine-wave” pattern. In the absence of visible P waves, this can easily be mistaken for an idioventricular rhythm or ventricular tachycardia, further complicating diagnosis and management.5
A Closer Look at Clinical Significance
Early and accurate identification of ECG changes has critical implications for patient outcomes, particularly in emergency settings. Notably, attempting defibrillation in ventricular rhythm, when severe hyperkalemia remains untreated, often precipitates asystole due to atrial arrest, emphasizing the critical importance of accurate diagnosis before initiating potentially harmful interventions.8
In terms of clinical importance, the nature of the ECG changes serves as a more reliable predictor of outcomes than the serum potassium level itself.9 Remarkably, there are reports of patients with severely elevated potassium levels, reaching as high as 8.3 mEq/L, who display minimal or no significant ECG changes.10
Brugada Phenocopies in Hyperkalemia: ECG Features Mimicking STEMI
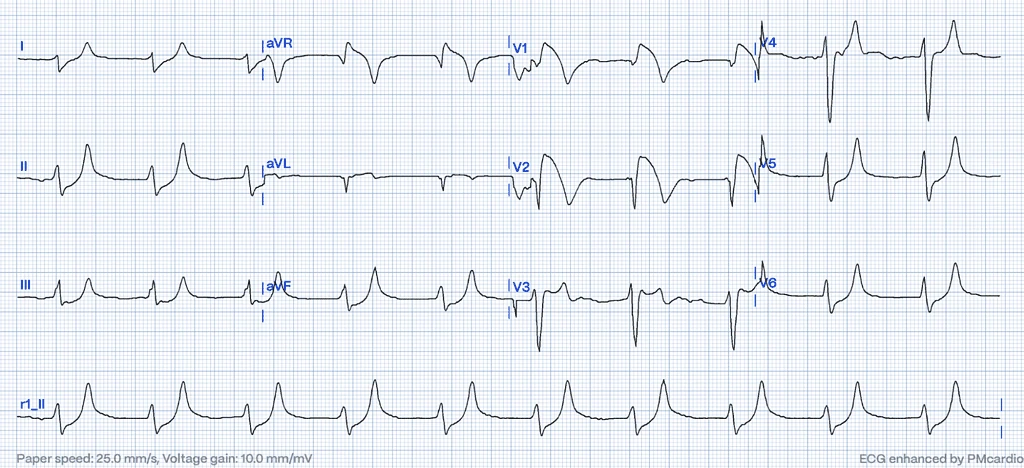
In severe cases of hyperkalemia, the ECG can mimic the ST-elevation pattern seen in myocardial infarction (STEMI). These changes result from alterations in cardiac membrane potential due to elevated potassium levels and often manifest prominently in anterior or precordial leads.11 Such patterns may resemble Brugada syndrome12,13, particularly in the right precordial leads (V1-V3). However, Brugada phenocopies differ from true Brugada syndrome as they are transient and arise from reversible causes such as metabolic disturbances, including hyperkalemia. These changes typically resolve with the correction of the underlying metabolic abnormality.
Identify STEMI Mimics with Certified AI
Leverage PMcardio platform to accurately distinguish true myocardial infarctions from STEMI mimics in seconds.
Distinguishing Hyperacute T Waves: Hyperkalemia vs. Hyperacute T-waves (HATW)
Despite advancements in detecting and treating acute coronary syndromes (ACS), MI remains a leading cause of mortality globally.14 Early identification of acute coronary occlusion and prompt initiation of reperfusion therapies are crucial to improving survival in patients with ST-segment elevation myocardial infarction (STEMI).15 However, the spectrum of ECG changes indicating acute coronary ischemia extends beyond the classic ST-segment elevation, encompassing less-recognized STEMI equivalents. Patients presenting with these atypical patterns, despite having acute coronary occlusion, are at risk of delayed revascularization, often leading to poorer outcomes and a worse prognosis.16,17 Alarmingly, only about 43% of acute myocardial occlusions meet the conventional STEMI millimeter criteria, highlighting a critical need for enhanced diagnostic vigilance.18
Hyperacute T-waves (HATW) are characterized by their increased height and width, along with a notably symmetric shape compared to normal T waves. This symmetry, combined with a broader base, leads to QT interval prolongation, recognized as one of the earliest detectable changes in acute coronary occlusion.19 Notably, a distinguishing attribute of these hyperacute T waves is their restriction to the myocardial region supplied by the occluded coronary artery.20 This localized presentation, together with the changes in height, width, and QT interval, makes hyperacute T waves a critical marker for identifying acute coronary events on an ECG. In a small percentage of cases, tall, symmetrical, and upright T waves may remain for several hours without the emergence of ST-segment elevation, despite the presence of a fully occluded epicardial coronary artery.21
Empowering Acute Care: AI-Driven Detection of Hyperkalemia
Although emergency physicians demonstrate high specificity in ECG interpretation, their sensitivity for diagnosing hyperkalemia remains limited.22 Leveraging AI-powered tools like PMcardio provides a critical advantage by enabling clinicians to make timely, informed decisions. Most importantly, PMcardio excels in distinguishing hyperacute T waves caused by acute occlusive myocardial infarctions from those associated with hyperkalemia. This capability is vital to prevent missed diagnoses of acute MI, ensuring patients receive rapid and appropriate treatment.
Conclusion
Hyperkalemia presents a unique diagnostic challenge due to its ECG changes, particularly peaked T waves, which can closely mimic hyperacute T waves – a critical STEMI equivalent pattern indicative of acute coronary occlusion. Misinterpreting these patterns can lead to delays in life-saving interventions. PMcardio leads the way in identifying hyperacute T-waves, ensuring the rapid detection of STEMI equivalents and facilitating prompt decision-making for STEMI management.23 While the definitive diagnosis of hyperkalemia requires blood tests, PMcardio’s ability to discern key ECG patterns supports clinicians in distinguishing between acute coronary events and other conditions, ultimately enhancing care in time-sensitive scenarios.
Identify STEMI Mimics with Certified AI
Leverage PMcardio platform to accurately distinguish true myocardial infarctions from STEMI mimics in seconds.
References
- 1. Kim D, Jeong J, Kim J, et al. Hyperkalemia Detection in Emergency Departments Using Initial ECGs: A Smartphone AI ECG Analyzer vs. Board-Certified Physicians. J Korean Med Sci. 2023;38(45):e322.
- 2. Truhlar A, Deakin CD, Soar J, Khalifa GE, Alfonzo A, Bierens JJ, et al. European resuscitation council guidelines for resuscitation 2015: section 4. Cardiac arrest in special circumstances. Resuscitation. 2015;95:148–201
- 3. Dillon JJ, DeSimone CV, Sapir Y, Somers VK, Dugan JL, Bruce CJ, et al. Noninvasive potassium determination using a mathematically processed ECG: proof of concept for a novel “blood-less, blood test”. J Electrocardiol 2015;48(1):12-8.
- 4. Attia ZI, DeSimone CV, Dillon JJ, Sapir Y, Somers VK, Dugan JL, et al. Novel bloodless potassium determination using a signal-processed single-lead ECG. J Am Heart Assoc 2016;5(1):e00274
- 5. Mattu A, Brady WJ, Robinson DA. Electrocardiographic manifestations of hyperkalemia. Am J Emerg Med 2000;18:721–9.
- 6. Freeman K, et al. Efects of presentation and electrocardiogram on time to treatment of hyperkalemia. Acad Emerg Med. 2008;15(3):239–49.
- 7. Hicks B. Hyperkalemia on ECG. J. Educ. Teach. Emerg Med. 2016;1(2):7–8
- 8. Peerbhai S, Masha L, DaSilva-DeAbreu A, Dhoble A. Hyperkalemia masked by pseudo-stemi infarct pattern and cardiac arrest. Int J Emerg Med. 2017 Dec;10(1):3. doi: 10.1186/s12245-017-0132-0. Epub 2017 Jan 26. PMID: 28124201; PMCID: PMC5267584.
- 9. Durfey N, Lehnhof B, Bergeson A, et al. Severe hyperkalemia: can the electrocardio_gram risk stratify for short-term adverse events? West J Emerg Med 2017;18: 963–71.
- 10. Martinez-Vea A, Bardaji A, Garcia C, Oliver JA. Severe hyperkalemia with minimal electrocardiographic manifestations: a report of seven cases. J Electrocardiol 1999;32(1):45–9.
- 11. Baranchuk A, Nguyen T, Ryu MH, et al. Brugada phenocopy: new terminology and proposed classification. Ann Noninvasive Electrocardiol 2012;17:299–314. [5] Xua G, Gottschalk BH, Anselm DD, et al. Relation of the Brugada phenocopy to hyperkalemia (from the International Registry on Brugada Phenocopy). Am J Cardiol 2018;121:715–7
- 12. Baranchuk A, Nguyen T, Ryu MH, et al. Brugada phenocopy: new terminology and proposed classification. Ann Noninvasive Electrocardiol 2012;17:299–314.
- 13. Xua G, Gottschalk BH, Anselm DD, et al. Relation of the Brugada phenocopy to hyperkalemia (from the International Registry on Brugada Phenocopy). Am J Cardiol 2018;121:715–7
- 14. Benjamin EJ, Muntner P, Alonso A, et al. Heart disease and stroke statistics-2019 update: a report from the American Heart Association. Circulation 2019;139:e56–528.
- 15. O’Gara PT, Kushner FG, Ascheim DD, et al. 2013 ACCF/AHA guideline for the management of ST-elevation myocardial infarction: executive summary: a report of the American College of Cardiology Foundation/American Heart Association Task Force on Practice Guidelines. J Am Coll Cardiol 2013;61:485–510
- 16. Pride YB, Tung P, Mohanavelu S, et al. Angiographic and clinical outcomes among patients with acute coronary syndromes presenting with isolated anterior ST-segment depression: a TRITON-IMI 38 (Trial to Assess Improvement in Therapeutic Outcomes by Optimizing Platelet Inhibition With Prasugrel-Thrombolysis In Myocardial Infarction 38) substudy. J Am Coll Cardiol Intv 2010;3:806–11.
- 17. Daly M, Finlay D, Guldenring D, et al. Detection of acute coronary occlusion in patients with acute coronary syndromes presenting with isolated ST-segment depression. Eur Heart J Acute Cardiovasc Care 2012;1:128–35
- 18. de Alencar Neto, J.N.; Scheffer, M.K.; Correia, B.P.; Franchini, K.G.; Felicioni, S.P.; De Marchi, M.F. Systematic review and meta-analysis of diagnostic test accuracy of ST-segment elevation for acute coronary occlusion. Int. J. Cardiol. 2024, 402, 131889.
- 19. Kenigsberg DN, Khanal S, Kowalski M, Krishnan SC. Prolongation of the QTc Interval Is Seen Uniformly During Early Transmural Ischemia. J Am Coll Cardiol. 2007 Mar 6;49(9):1299-305. doi: 10.1016/j.jacc.2006.11.035
- 20. de Winter RJ, Verouden NJ, Wellens HJ, Wilde AA. A new ECG sign of proximal LAD occlusion. N Engl J Med. 2008;359(19):2071-3
- 21. Birnbaum GD, Birnbaum I, Birnbaum Y. Twenty years of ECG grading of the severity of ischemia. J Electrocardiol. 2014;47(4):546–55. https:// doi. org/ 10. 1016/j. jelec troca rd. 2014.02.003.
- 22. Rafique, Zubaid et al. “Can Physicians Detect Hyperkalemia Based on the Electrocardiogram?” The American journal of emergency medicine 38.1 (2020): 105–108.
- 23. Herman R, Meyers HP, Smith SW, et al. International evaluation of an artificial intelligence–powered electrocardiogram model detecting acute coronary occlusion myocardial infarction. Eur Heart J – Digit Health. 2023;5(2):123-133. doi:10.1093/ehjdh/ztad074.
Share this article



About PMcardio
PMcardio is a CE-marked Class IIb AI medical device that interprets any 12-lead ECG — from a photo or a digital file — in seconds. It detects 50+ ECG findings, including occlusion myocardial infarction (OMI) — the acute coronary occlusions that conventional STEMI criteria miss in over half of cases. Its Queen of Hearts™ OMI model holds FDA Breakthrough Device Designation, and PMcardio is already used by 100,000+ clinicians who have analyzed more than 2.5 million ECGs.

About Powerful Medical
Powerful Medical is a medical-technology company using artificial intelligence to transform how cardiovascular disease — the world’s leading cause of death — is diagnosed. Founded in 2017, it built PMcardio, the world’s first AI medical device to detect acute coronary occlusion (OMI) from an ECG. Its research is published in the European Heart Journal – Digital Health and validated across 25+ clinical studies, and its Queen of Hearts™ model earned FDA Breakthrough Device Designation. To date, PMcardio has supported the detection of 120,000+ heart attacks across 150+ hospital deployments worldwide.